
Going Agile with Planio » History » Revision 41
« Previous |
Revision 41/63
(diff)
| Next »
Thomas Carney, 06/29/2015 05:15 PM
Setting Up Your Planio Account for Agile Project Management
Planio lets you use agile methodologies such as Scrum, Kanban or Extreme programming for your projects.
- Table of contents
- Setting Up Your Planio Account for Agile Project Management
Agile Methodologies
Agile methodologies includes a group of software development methods such as Scrum, Kanban or Extreme programming. They’re all based on the idea that requirements and solutions evolve through collaboration between self-organizing, cross-functional teams.
This tutorial will help you set up your account for one of these methodologies.
What you can do with Planio's Agile App?
Once it’s set up, you'll be able to:
- see all the sprint items on one board;
- drag-n-drop items or update them on the board;
- plan your sprints and create issue backlogs;
- generate burndown charts, cumulative flow charts, velocity charts and more.
Getting Set Up
Make sure that the Agile app is installed. Go to the Apps tab and install the Agile app.

Make sure the App is installed
Start Simple
We've found that you'll have the most success if you start off with a simple setup. Once you've completed a few sprints with Planio, you'll be in a better position to see which customizations make sense for you.
Plan a Sprint
If you don't have any issues in your project, add some issues now. Then, once your project has issues, it's time to plan your next sprint. Click on New Sprint. Give a name to your new sprint such as Sprint #1 and set the start date. Now, you can drag an issue from the Issues without sprint column to the sprint you just created.

View Items on Your Agile Board and Create Sprint Views
Click on Agile board in the navigation bar and you'll see the the issues laid out on the Agile board. By default, you'll see all issues in the project, rather than just the issues for the current sprint.
Therefore, we'll create and save a filter for the current sprint. Click on Add filter in the top right hand corner and select the Sprint/Milestone. Make sure the Sprint/Milestone is set to the current sprint and click Save.

On the next page, you can name this filter, make it visible to all users and set it as the default board, so you don't have to select this filter each time.

It will appear in the right sidebar under My agile boards.
You can now drag and drop issues on your Agile board. You can also update items by right-clicking on them (Windows) or double-clicking on them (Mac).

Graphs, Graphs, Graphs!
Click on Add filter, select Sprint/Milestone and set it to the current sprint, so you can see the charts as they relate to the current sprint.
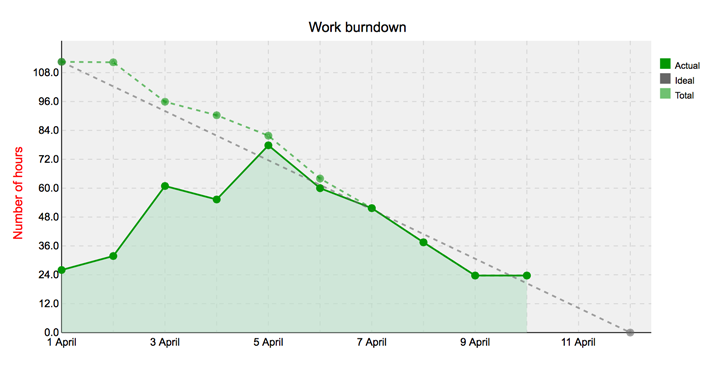
Burndown charts show you how a project is progressing. They highlights the impact of adding new feature requests, and they'll let you know if things aren't going according to plan.
The velocity chart shows you the output of a team per sprint.

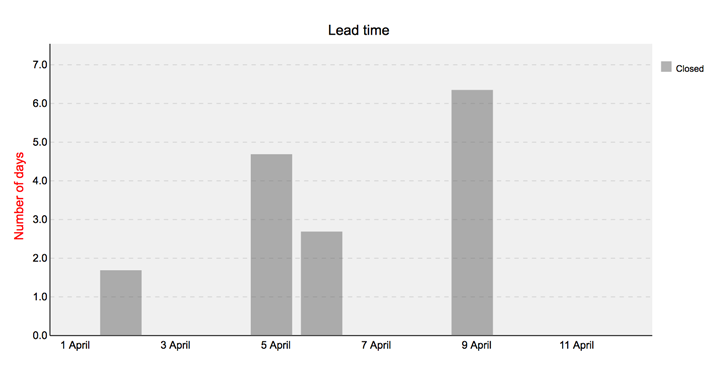
Lead time is the time between an issue being opened and being closed. Teams using a Kanban approach often favor this method over the velocity chart, and they'll focus on improving the lead time rather than velocity.
Cumulative flow shows how issues are 'flowing' through different statuses.
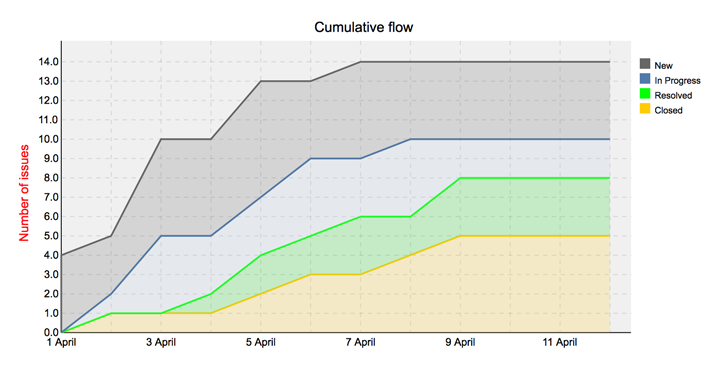
Cumulative flow charts help answer questions such as:
- Are issues reaching their final state?
- Is there a particular status that's tacking a lot of time?
- How long does it take you to go from an idea to value?
- Is the scope of the project changing over time?
Updated by Thomas Carney over 9 years ago · 41 revisions